
Are we about to set yet another new record for the worst general election voter turnout in Washington State history? It unfortunately looks like the answer is likely to be yes, based on an analysis by our team at NPI of the latest ballot return statistics published by the Secretary of State’s office yesterday evening.
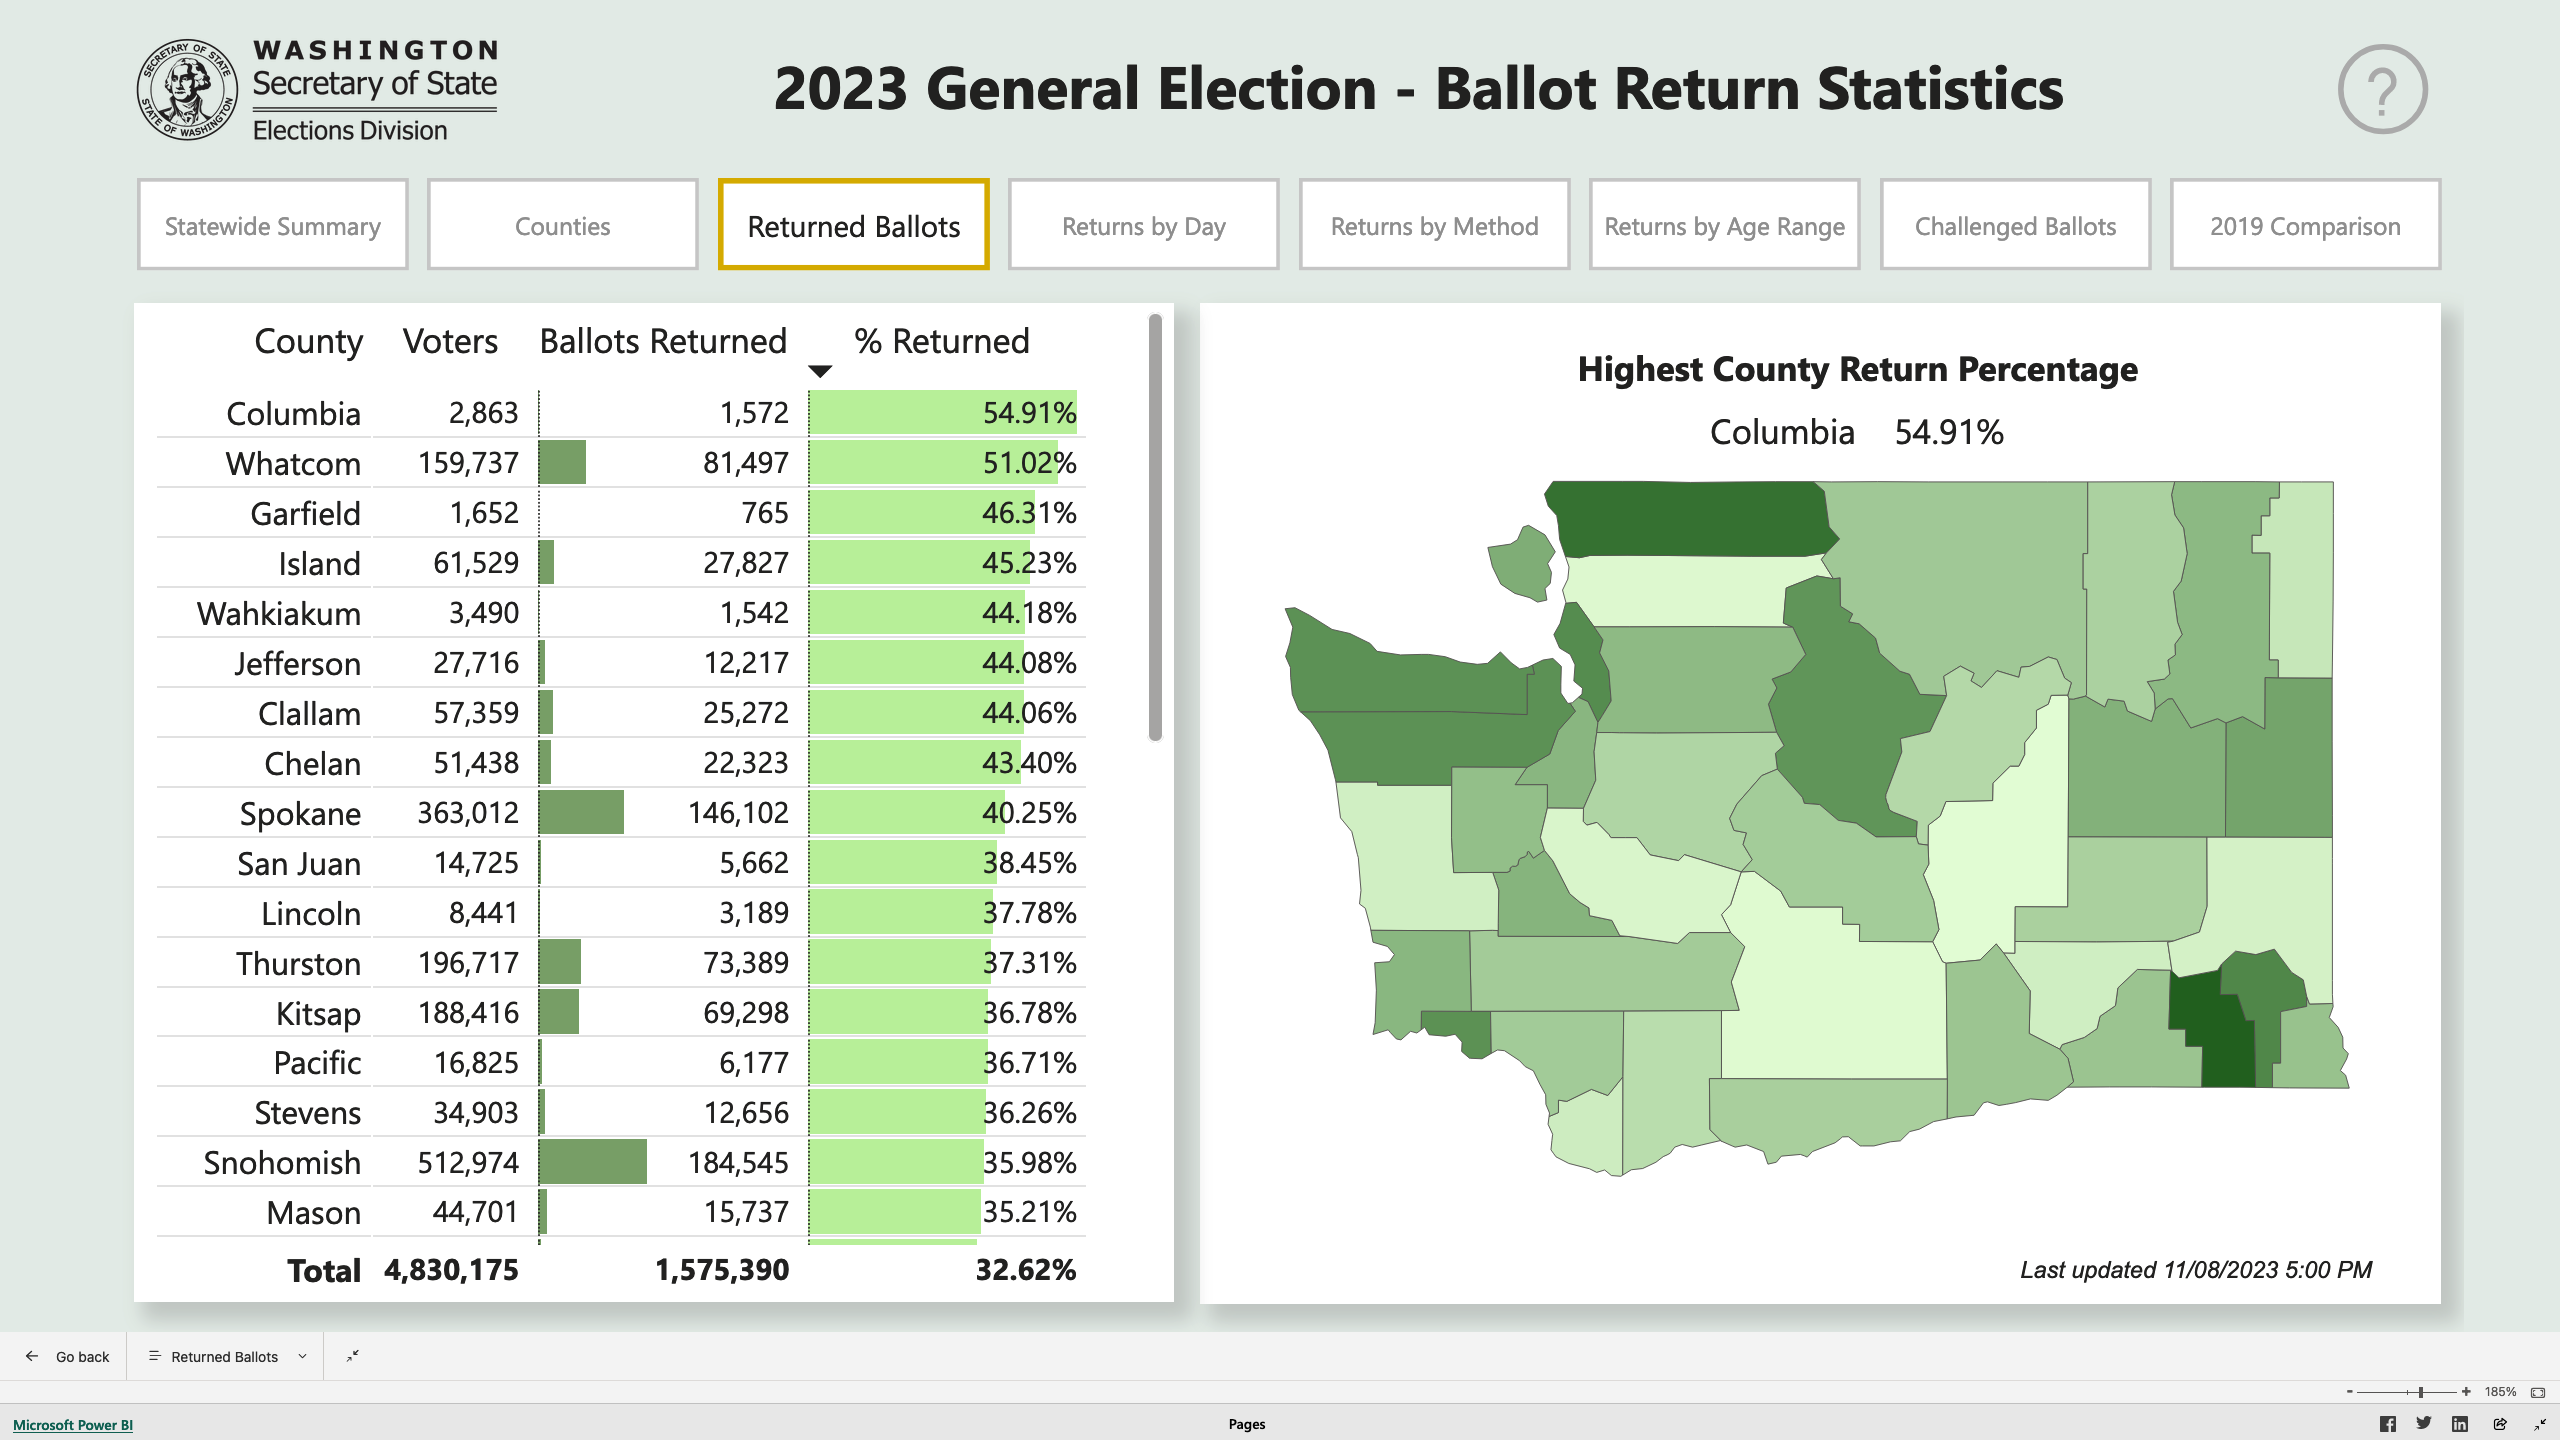
With Election Day having come and gone, the Secretary of State’s data shows that 32.62% of ballots have been returned as of one day after the election. That’s not even a third of the electorate. And only 24.71% of the ballots sent to Washington’s more than 4.8 million registered voters have been counted.
The turnout percentage is going to rise, because more ballots returned through the United States Postal Service are making their way to county elections offices across Washington. But there’s a real risk we set a new low record for turnout. Election Day participation appears to have been unusually low this year.
At this point in 2019, the last comparable election four years ago, which had the eighth worst turnout in state history, the percentage of returned ballots was 40.95%, as you can see from the Secretary of State’s helpful comparative chart in Power Bi, an interactive tool they use for presenting ballot return statistics:

We’re way, way behind 2019, so there’s no doubt this turnout will be one of the worst in state history. 2023 will easily rank above 2019 and 2013 on the worst turnouts of all time list, and probably 2021 too. Can it also surpass 2015, which had the second worst turnout, and 2017, which had the worst ever?
Sadly, we believe it can.
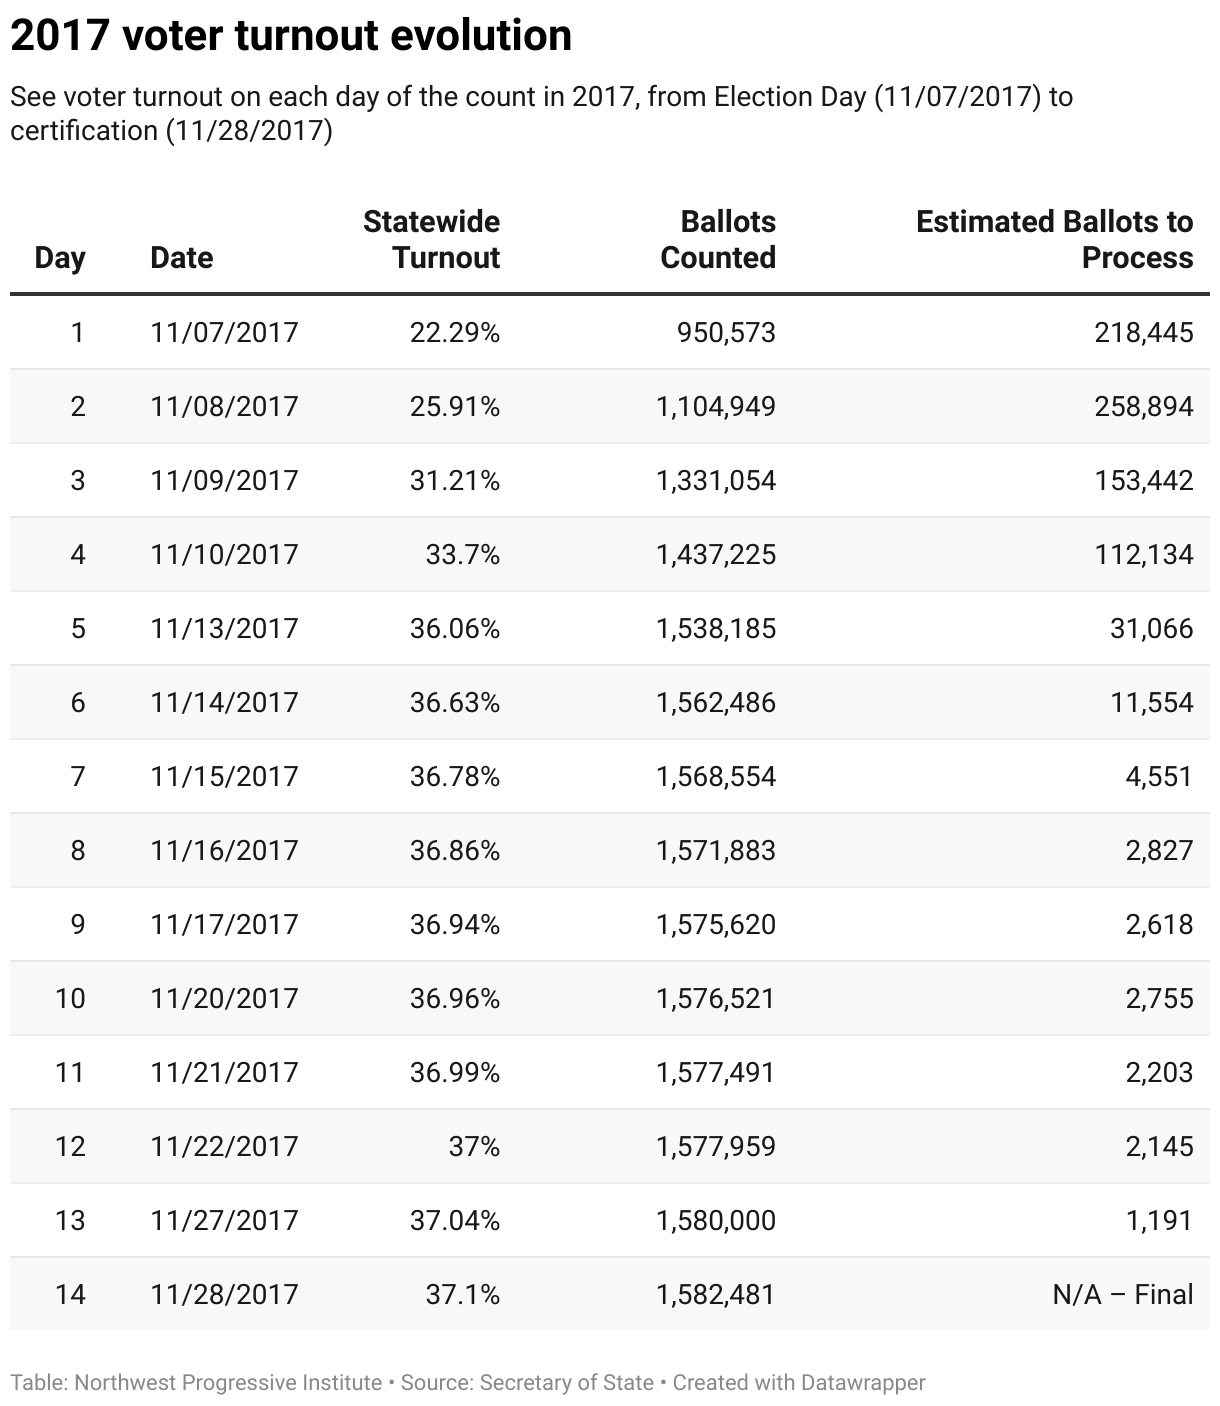
To get a better sense of the trajectory we are on and how it compares to six years ago, we went into our archives and examined all of our snapshots of data published by the Secretary of State from 2017.
You can see below the turnout percentages through each day of counting in the table below. These are the percentages of tallied — not returned — ballots. The estimated number of ballots remaining to be processed is also shown.
We are two days into the 2023 count; here are the numbers for this year:
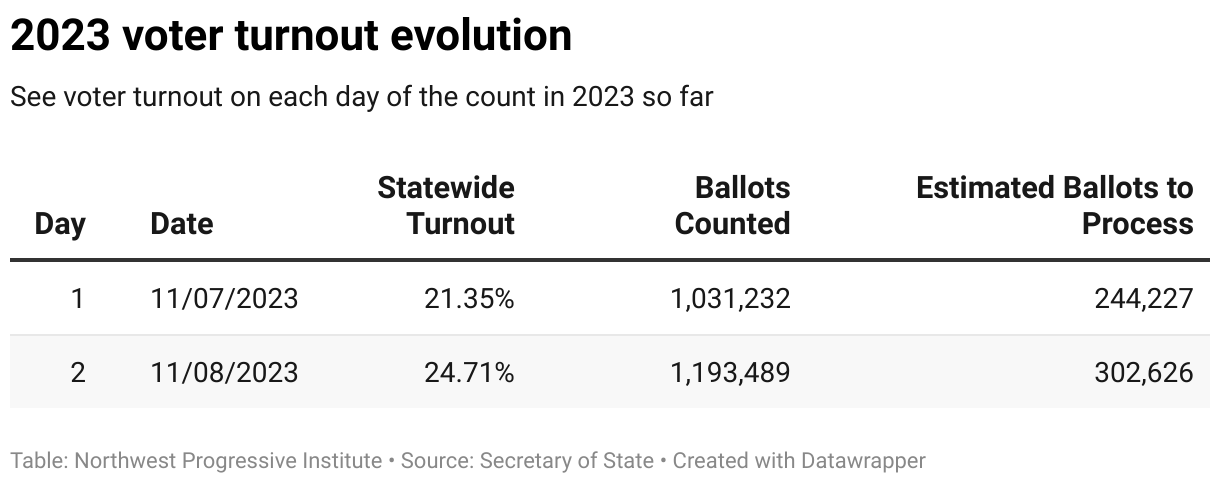
On the first day of counting in 2017, 22.29% of registered voters had had their ballots counted. This year, only 21.35% had. On the second day of counting in 2017, participation rose to 25.91%; this year, on the second day of counting, it was 24.71%. An estimated 302,626 ballots remain to be processed.
If they all were to get counted, that would take turnout up to about 30.97%.
That’s not the end of the story, though.
Remember, the Secretary of State is reporting that 32.62% of ballots have been returned as of yesterday. Not all returned ballots get counted because some have issues — like the signature doesn’t match. Presently, in this election, there are 13,711 challenged ballots. 8,850 have a signature mismatch, 4,795 are unsigned, and twenty-five have no signature on file (which is odd).
30.87% of ballots have been accepted; while 1.19% have been challenged.
Today and tomorrow, the United States Postal Service is expected to deliver the bulk of the remaining ballots that were mailed by in-state voters in this election before the Tuesday deadline arrived. Then, deliveries will slow to a trickle.
For turnout to surpass 2017, we’d need about 1.79 million voters to participate at a minimum. We have 4,830,175 registered voters in this election and 37.11% of that electorate would be about 1,792,477. Again, 1,193,489 ballots have been counted and there are an estimated 302,626 ballots on hand for processing.
If all are counted, we get up to 1,496,115 registered voters voting.
Are there another three hundred thousand or so ballots out there making their way to county elections officials that aren’t included in the return figure yet?
It seems unlikely.
Here are the Day Two estimated ballots to be processed numbers for all recent odd-year elections. You can see that in both 2021 and 2019, there were a lot more ballots awaiting processing on the second day than this year.
- 2023 Day 2 Estimated Ballots to Process: 302,626
- 2021 Day 2 Estimated Ballots to Process: 512,130
- 2019 Day 2 Estimated Ballots to Process: 623,814
- 2017 Day 2 Estimated Ballots to Process: 258,894
- 2015 Day 2 Estimated Ballots to Process: 283,001
- 2013 Day 2 Estimated Ballots to Process: 422,157
And here are some recent even years for additional comparison:
- 2022 Day 2 Estimated Ballots to Process: 745,330
- 2020 Day 2 Estimated Ballots to Process: 409,826
- 2018 Day 2 Estimated Ballots to Process: 723,438
- 2016 Day 2 Estimated Ballots to Process: 791,555
- 2014 Day 2 Estimated Ballots to Process: 501,376
Ballot processing operations in several major counties were significantly disrupted yesterday after an unknown bad actor or actors sent envelopes containing baking soda and traces of fentanyl to county elections offices. The subsequent facility evacuations and law enforcement investigations slowed down operations in King, Pierce, Spokane, and Skagit counties. Spokane opted not to run a tabulation.
By the end of tomorrow, we should have much more data to work with that will better illuminate our trajectory. We’ll keep a close eye on the turnout data and bring you further updates and analysis throughout the vote counting period.
What can be done about this?
At NPI, we’ve been sounding the alarm for years about election fatigue. It is a real and growing problem in Washington and elsewhere in the United States. We’ve done great work here and in Oregon to make voting easy, and that work has helped increase turnout in even-numbered years. But in odd-numbered years, most voters are not turning out. The trend looks really, really bad.
If we want Washington State’s local officials to be chosen by the many rather than a few, then we need to act. Most counties are already holding their regular elections in even years, but cities cannot. A state law dating back to the 1960s currently locks all Washington municipalities into odd years — they have no choice but to hold their regular elections for mayor, city attorney, city council, and other offices in years when the electorate is smaller, older, richer, and whiter.
NPI has developed legislation to allow cities and towns to regain the freedom to choose their election timing. Senate Bill 5723, prime sponsored by our champion Senator Javier Valdez, is currently parked in Senate Rules. It will be our top priority for the 2024 legislative session. If you are interested in helping get it passed, please reach out. You can text us at 425–310-2785.
More background about the bill is available at evenyears.org and our friends at Sightline have just published a hugely useful deep dive that looks at the voter turnout penalty Washington cities and towns are paying due to being forced to hold their elections in odd-numbered years. Be sure to check that out here.