
Tomorrow — Tuesday, November 7th, 2017 — is General Election Day across Washington State. Although there are no statewide positions at stake or even statewide initiatives on the ballot this year, five legislative districts are holding special elections — the outcome of which will determine who controls the Senate in 2018.
At the same time, thousands of local governments across Washington State (most cities and some counties, plus ports, and special districts) are holding their regular elections. Most jurisdictions have several legislative positions to fill, but some have executive and/or judicial positions as well, including the state’s largest cities (Seattle, Tacoma, and Everett all have open mayoral positions).
Sadly, voter turnout remains extremely low as of this morning, with just thirty hours to go before the deadline arrives to return ballots. Only 16.8% of registered voters had returned their ballots as of this morning’s 8 AM report.
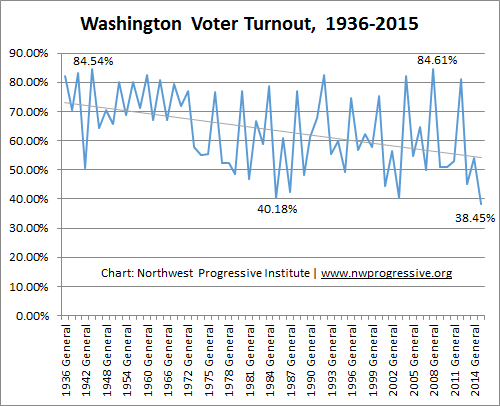
Alarmingly, Washington State appears to be on course to set a new low record for voter turnout in a general election, erasing the dubious distinction set in November 2015 during the last local election year.
Two years ago, the morning before Election Day, the Secretary of State reported that 17.2% of registered voters had returned ballots. That’s a couple of ticks higher than the turnout authorities are currently reporting for 2017. And that 2015 election became the record setter for the worst turnout in the recorded electoral history of Washington State, with only 38.45% of registered voters participating.
It would appear we are on pace to do even worse this year… unless we act quickly.
What can we do? Everyone reading this post has an obligation to do our part to boost voter turnout. That means going above and beyond voting ourselves. It means checking up on friends and family and asking them to do their civic duty.
We are blessed to live in a democratic republic where we get to choose our leaders as opposed to an authoritarian regime where we have no voice and no vote in our governance. Voting is an important obligation of citizenship.
There are no acceptable excuses for not voting, especially not when three weeks are provided to fill out and return ballots, which is the case here in Washington.
So please: Talk to your colleagues, family, and friends about tomorrow’s election. Ask them if they’ve voted. If they have, thank them.
And if they haven’t, offer to help them make a plan for voting. Research shows that people are more likely to vote when they make a plan to vote.
Here’s the complete set of figures for turnout in 2015 versus 2017.
2015 turnout as of 9:45 AM the Monday before Election Day (11/02/2015)
| County | Voters | Returned | Percentage |
| STATE TOTAL | 3,966,277 | 680,324 | 17.2% |
| ADAMS | 6,180 | 1,289 | 20.9% |
| ASOTIN | 13,323 | 3,723 | 27.9% |
| BENTON | 99,328 | 16,164 | 16.3% |
| CHELAN | 40,567 | 9,268 | 22.8% |
| CLALLAM | 47,374 | 9,312 | 19.7% |
| CLARK | 251,348 | 48,333 | 19.2% |
| COLUMBIA | 2,621 | 872 | 33.3% |
| COWLITZ | 59,411 | 9,384 | 15.8% |
| DOUGLAS | 19,595 | 4,007 | 20.4% |
| FERRY | 4,567 | 1,160 | 25.4% |
| FRANKLIN | 30,460 | 3,915 | 12.9% |
| GARFIELD | 1,540 | 465 | 30.2% |
| GRANT | 36,592 | 8,173 | 22.3% |
| GRAYS HARBOR | 38,621 | 9,416 | 24.4% |
| ISLAND | 50,338 | 12,043 | 23.9% |
| JEFFERSON | 22,949 | 6,989 | 30.5% |
| KING | 1,193,711 | 181,284 | 15.2% |
| KITSAP | 153,824 | 29,696 | 19.3% |
| KITTITAS | 22,192 | 4,400 | 19.8% |
| KLICKITAT | 13,307 | 2,233 | 16.8% |
| LEWIS | 43,703 | 10,893 | 24.9% |
| LINCOLN | 6,865 | 2,319 | 33.8% |
| MASON | 35,711 | 8,821 | 24.7% |
| OKANOGAN | 21,434 | 5,214 | 24.3% |
| PACIFIC | 13,504 | 4,719 | 34.9% |
| PEND OREILLE | 8,414 | 2,385 | 28.3% |
| PIERCE | 449,340 | 63,210 | 14.1% |
| SAN JUAN | 12,151 | 3,773 | 31.1% |
| SKAGIT | 69,069 | 13,114 | 19.0% |
| SKAMANIA | 7,094 | 1,272 | 17.9% |
| SNOHOMISH | 421,389 | 53,698 | 12.7% |
| SPOKANE | 285,258 | 57,899 | 20.3% |
| STEVENS | 29,046 | 2,301 | 7.9% |
| THURSTON | 163,893 | 26,430 | 16.1% |
| WAHKIAKUM | 2,964 | 764 | 25.8% |
| WALLA WALLA | 32,176 | 7,999 | 24.9% |
| WHATCOM | 128,345 | 27,825 | 21.7% |
| WHITMAN | 20,353 | 4,237 | 20.8% |
| YAKIMA | 107,720 | 21,325 | 19.8% |
| STATE TOTAL | 3,966,277 | 680,324 | 17.2% |
2017 turnout as of 8 AM today (11/06/2017)
| County | # of Voters | Returned | Percentage |
|---|---|---|---|
| STATE TOTAL | 4,267,160 | 717,253 | 16.8% |
| ADAMS | 6,612 | 680 | 10.3% |
| ASOTIN | 14,607 | 3,944 | 27.0% |
| BENTON | 106,329 | 21,559 | 20.3% |
| CHELAN | 43,295 | 9,989 | 23.1% |
| CLALLAM | 50,902 | 12,008 | 23.6% |
| CLARK | 272,714 | 44,216 | 16.2% |
| COLUMBIA | 2,740 | 826 | 30.1% |
| COWLITZ | 62,726 | 12,514 | 20.0% |
| DOUGLAS | 21,094 | 3,886 | 18.4% |
| FERRY | 4,590 | 1,509 | 32.9% |
| FRANKLIN | 33,722 | 5,790 | 17.2% |
| GARFIELD | 1,612 | 759 | 47.1% |
| GRANT | 39,631 | 8,650 | 21.8% |
| GRAYS HARBOR | 41,154 | 8,791 | 21.4% |
| ISLAND | 54,986 | 12,902 | 23.5% |
| JEFFERSON | 24,328 | 8,487 | 34.9% |
| KING | 1,279,030 | 196,546 | 15.4% |
| KITSAP | 164,193 | 34,376 | 20.9% |
| KITTITAS | 24,418 | 4,584 | 18.8% |
| KLICKITAT | 14,014 | 2,929 | 20.9% |
| LEWIS | 45,922 | 11,367 | 24.8% |
| LINCOLN | 7,165 | 2,209 | 30.8% |
| MASON | 38,193 | 9,057 | 23.7% |
| OKANOGAN | 22,585 | 5,098 | 22.6% |
| PACIFIC | 14,333 | 4,058 | 28.3% |
| PEND OREILLE | 8,828 | 2,393 | 27.1% |
| PIERCE | 493,778 | 59,759 | 12.1% |
| SAN JUAN | 12,902 | 3,493 | 27.1% |
| SKAGIT | 73,380 | 14,429 | 19.7% |
| SKAMANIA | 7,558 | 1,108 | 14.7% |
| SNOHOMISH | 456,517 | 59,174 | 13.0% |
| SPOKANE | 305,789 | 55,986 | 18.3% |
| STEVENS | 29,811 | 7,844 | 26.3% |
| THURSTON | 175,697 | 27,668 | 15.7% |
| WAHKIAKUM | 3,020 | 749 | 24.8% |
| WALLA WALLA | 33,518 | 6,897 | 20.6% |
| WHATCOM | 138,607 | 27,699 | 20.0% |
| WHITMAN | 22,062 | 4,233 | 19.2% |
| YAKIMA | 114,798 | 19,087 | 16.6% |
| STATE TOTAL | 4,267,160 | 717,253 | 16.8% |