
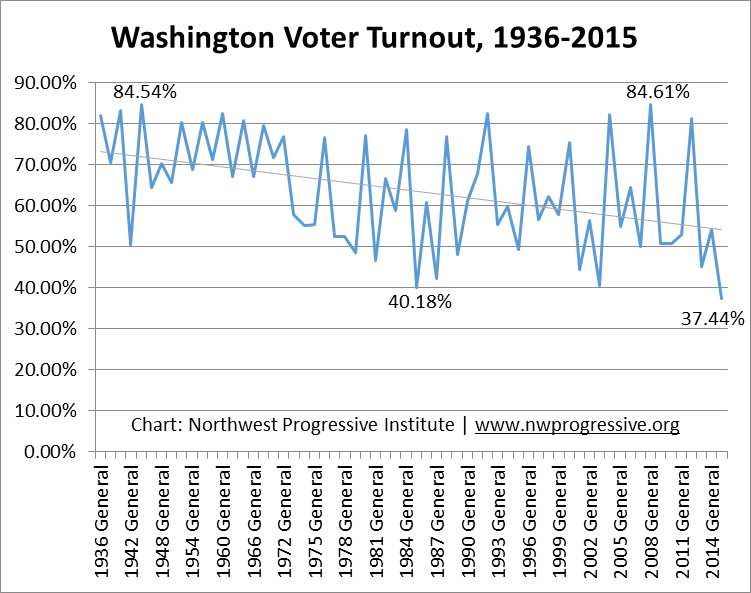
As of this evening, it’s been one week since Election Night 2015, and the number of ballots still awaiting processing by county elections officials has dwindled to less than thirty-three thousand statewide. Turnout currently stands at 37.44%, and it looks like it will end up under forty percent, well below Secretary of State Kim Wyman’s optimistic forecast of forty-six percent from last month.
Anyone who follows politics, including Cascadia Advocate readers, is probably already aware that turnout so far this year has been poor. But as county elections officials run out of ballots to add to the count, we got to wondering: Just how bad is this year’s turnout compared to past years?
The disturbing answer is that this year’s low general election turnout is absolutely unprecedented. It could be the worst in state history.
We’re not sure whether it is or not, because the historic turnout data kindly furnished to us by the fine folks who work in Secretary of State Kim Wyman’s office only goes back to 1936. But this much we know: Turnout in 2015 will likely be at least the worst general election turnout in over seventy-five years.
That is a truly sobering thought. So much for vote-by-mail being a turnout booster.
It is worth noting that, for much of Washington’s history, statewide general elections were only held in even-numbered years. In the early 1970s, state law was changed to provide for state-level general elections in odd-numbered years, too. Before 1973, only local offices were contested in odd-numbered years.
The first few such elections had midterm-like turnout above a majority: 57.78% in 1973, 55.47% in 1975, 52.47% in 1977. Beginning in 1979, turnout in odd-numbered years started regularly dipping below fifty percent.
General election turnout previously reached a low of 40.18% thirty years ago, in 1985, rebounding to 42.32% in 1987 and 48.11% in 1989.
Since then, odd-numbered general election year turnout has fluctuated. It’s been above a majority in certain years and below it in others.
But never has it been as bad as this year.
The kind of turnout we’re seeing in this year’s general election is the kind we usually expect to see in a Top Two election. Voter turnout in the 2012 Top Two, for instance, was 38.48%, a whole percentage point higher than the current 2015 general turnout (which will rise slightly before certification on November 24th).
Here is a turnout table showing all odd-numbered general elections since 1973:
| Year | Registered Voters | Ballots Counted | % Voted |
| 2013 | 3,914,786 | 1,772,290 | 45.3 |
| 2011 | 3,658,413 | 1,936,950 | 52.9 |
| 2009 | 3,583,278 | 1,823,364 | 50.9 |
| 2007 | 3,288,642 | 1,645,652 | 50.0 |
| 2005 | 3,374,541 | 1,850,017 | 54.8 |
| 2003 | 3,212,043 | 1,300,602 | 40.5 |
| 2001 | 3,291,103 | 1,464,891 | 44.5 |
| 1999 | 3,099,553 | 1,790,518 | 57.8 |
| 1997 | 3,032,992 | 1,718,307 | 56.7 |
| 1995 | 2,834,181 | 1,397,039 | 49.3 |
| 1993 | 2,780,033 | 1,542,599 | 55.5 |
| 1991 | 2,266,617 | 1,539,034 | 67.9 |
| 1989 | 2,221,407 | 1,068,721 | 48.1 |
| 1987 | 2,171,365 | 918,816 | 42.3 |
| 1985 | 2,239,900 | 900,078 | 40.2 |
| 1983 | 2,109,096 | 1,238,395 | 58.7 |
| 1981 | 2,029,631 | 948,359 | 46.7 |
| 1979 | 1,902,047 | 923,237 | 48.5 |
| 1977 | 1,890,287 | 991,844 | 52.5 |
| 1975 | 1,803,422 | 1,000,427 | 55.5 |
| 1973 | 1,821,514 | 1,052,526 | 57.8 |
Note that percentages in this chart have been rounded to one decimal place.
As you can see, in the more than forty years since we have held state-level general elections in odd-numbered years, we have never had turnout fall below forty percent. But it looks like it’s going to happen this year.

Above is a chart showing voter turnout in Washington from 1936 to the present day. The high peaks are presidential election years. The valleys are initially midterms, and then, starting in 1973, they are odd-numbered years, after the state started tacking ballot measures and special elections onto local elections.
The highest and lowest turnout in modern times and the highest and lowest turnout in the state’s younger years are noted on the chart.
Considering how big the turnout disparity has gotten in modern times, it is worth discussing whether state-level elections should revert to being held solely in even-numbered years. This would mean that we would only consider initiatives and referenda every two years, as opposed to every year.
This is how it works in Oregon, which also has a vote-by-mail elections system.
From our perspective, it doesn’t make sense for a minority of the state’s registered voters to be making laws for the majority. Even in midterm cycles where turnout is unusually poor, like in 2014 or 2002, turnout has still been more than a majority, so if we only considered initiatives, referenda, and constitutional amendments in even-numbered years, we would not have the few making decisions for the many.
Recent presidential elections do compare more favorably to those from decades past. In 1944, Washingtonians turned out in large numbers to vote in the nation’s final wartime election, which pitted Democrat Franklin Delano Roosevelt against Republican Thomas E. Dewey. That record high turnout went unmatched until 2008, when Barack Obama squared off against John McCain.
But again, this year’s turnout is simply awful. It’s embarrassing. We don’t yet know what the exact figure will be, but we do think it’s reasonably safe to conclude it won’t be more 40.18%, the previous low. By bringing this up now, we hope to help foster a conversation about what we can do to bolster turnout in the future, while this year’s election is still fresh in the minds of those Washingtonians who follow politics.
Comments are closed.